
Unless you live in an ice cave, and have never been exposed to television, movies and newspapers, you know that criminals are hiding in every alley, ready to shoot you for the $13 in your wallet unless the serial killer over there gets you first.
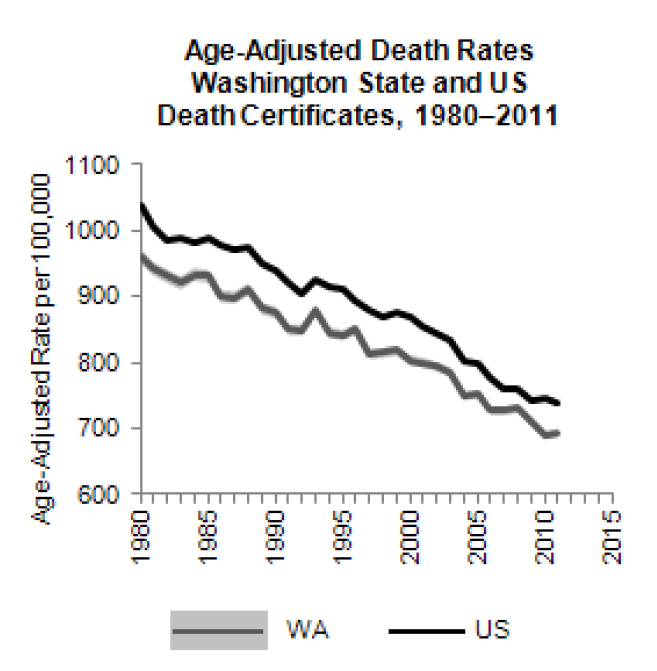
While coverage of murder and mayhem in the media is way, way up, the actual numbers for deaths in Washington state–from every possible cause–has been steadily dropping.
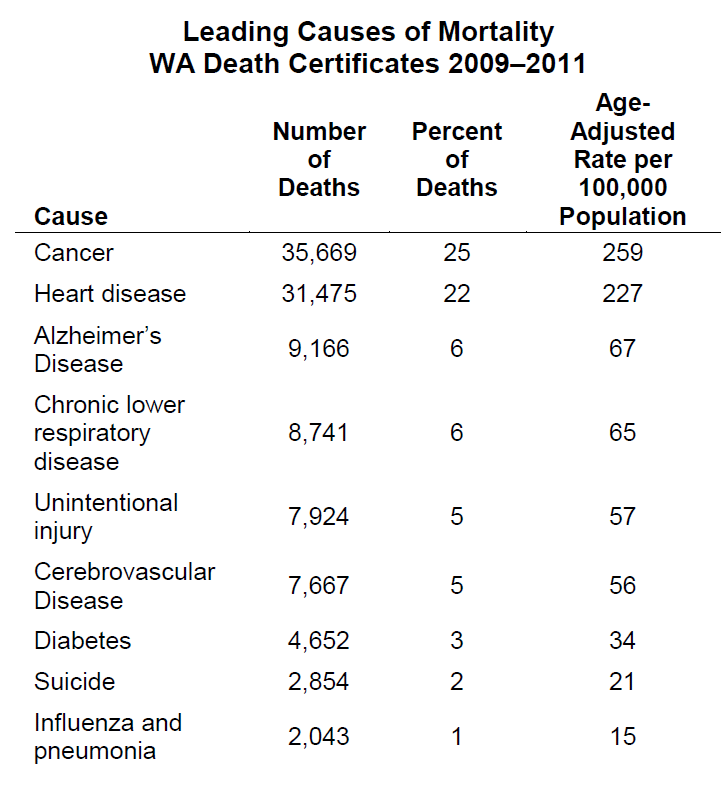
The latest numbers are from the state Department of Health, which examined the cause of death for all 49,386 residents of our state who died in 2011.
Washington state has historically had a lower death rate than the national average, and we’ve consistently kept that advantage even as the national average dropped like a stone in the last 30 years.
Also important: You are far more likely to die from a car crash, or cancer, than at the hands of a criminal.
This isn’t simply a piece of trivia.
Every county in Washington state spends upwards of 70 percent of their budget on criminal justice. Sheriff deputies and prosecutors, judges and jails.
Yet it’s also useful to look at the real numbers once and a while to see where trouble lies.
 Drunk driving and domestic violence, for example, may seem far less important than murders. Yet if you look deep at these numbers and other state statistics, the leading cause of deaths for teenagers and children is car crashes, and alcohol is a contributing factor in those crashes and all wrecks that happen on our highways.
Domestic violence is also a precursor to homicides. Murder victims typically die not at the hands of strangers, but of family and friends. People they know and trust.
Also, sharks. JAWS may be a great movie, but more people in our state die from bee stings and mountain goat gorings than from being chomped in two by a great white.
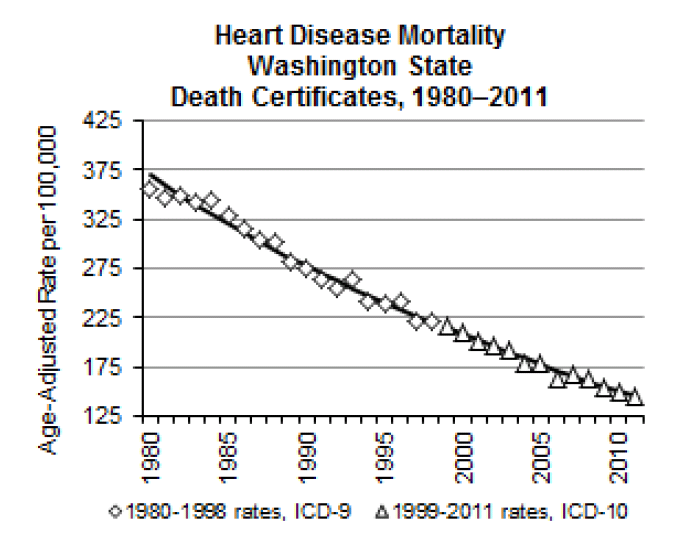
There’s more good news when it comes to deaths from heart disease. You could sled down the curve on this chart, with dramatic and steady progress from 1980 all the way to 2011.
To read the full report, which has even more charts, click here.