How did our state’s economy really do in 2013?
The Economic Opportunity Institute took a hard look at the numbers and came out with a report, full of interesting facts and charts.
For people in a rush, here’s the TL;DR: Washington state’s unemployment rate is 6.8 percent, a bit lower than the national average of 7 percent; the highest job growth is in King County; and families in Washington make $11,000 more than average American households.
Everyone else can read the full report here, but here are some highlights:
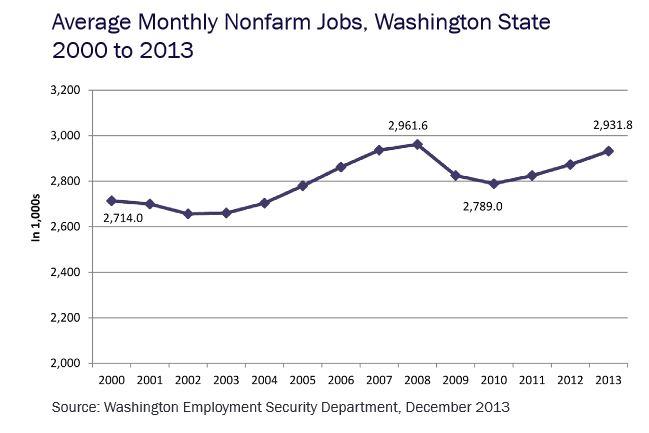
1. Washington has almost recovered all the jobs lost during the global recession
This chart tells the story, which has a happy ending.
 2. Booms and busts are not shared equally
According to the report, different parts of our state’s economy behave quite differently.
Construction added 50,000 more jobs during the boom, then lost 70,000 jobs during the global recession that started in 2008. That’s one-third of the industry and its jobs, gone.
Manufacturing also follows a boom and bust pattern, says the EOI. There were 360,000 manufacturing jobs in the state in 1998, then it fell to 264,000 in 2004, gained 30,000 jobs, lost 35,000 jobs in 2010 and is slowly climbing again.
Retail and restaurant work also follows this boom and bust cycle.
Public servants, on the other hand, are in a long steady decline despite a growing population.
Health care jobs seem immune to the economic booms and recessions. They’ve grown in Washington state, says the EOI, during the 2001 and 2008 recessions, with “barely a hiccup.”
3. Most of the job growth is in King County
The report states that King County, “which is home to about 40 percent of the state’s jobs, accounted for 62 percent of job growth statewide in 2013. Since 2010, 59 percent of statewide job growth has been in King County.”
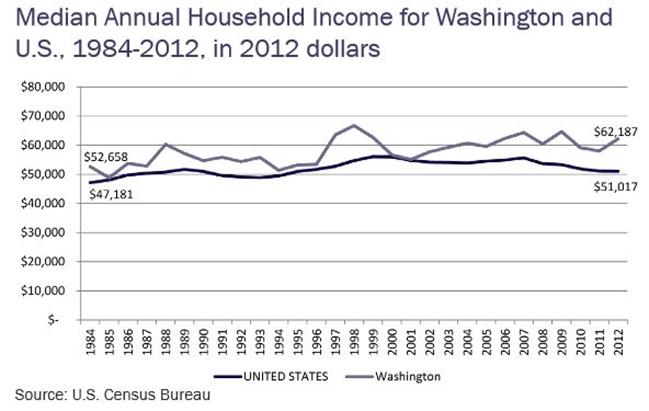
4. People in Washington state have higher incomes than the average American
The average family in Washington makes about $11,000 more per year than the national average. This gap has grown since the 1980s.

