If you took a guess, high school kids would probably get into roughly as much trouble as college-aged people.
Yet looking at the hard numbers makes those crazy teenagers look like saints.
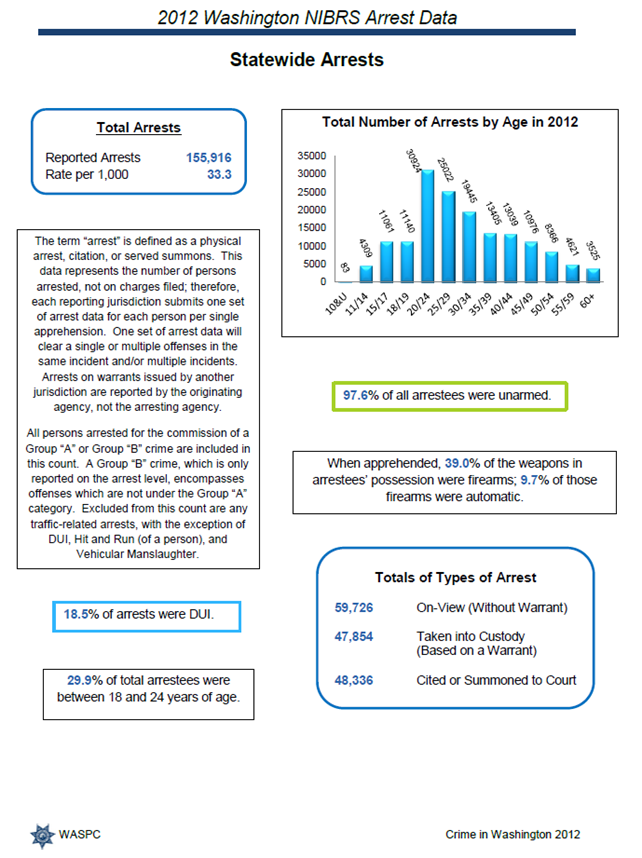
The biggest group of people arrested, by a mile, are aged 20 to 24.
That group keeps police busy, accounting for 30 percent of all arrests in Washington state, according to the Crime in Washington 2012 report by the Washington Association of Sheriffs and Police Chiefs.
Since most people who get handcuffed are men, it’s not a leap of logic to look at young men between the ages of 20 to 24, if you want to prevent crime.
Here’s a good chart from the report on who gets arrested in Washington state. Many of the arrests actually happen based on outstanding warrants (47,854) or being summoned to court (48,336) versus being arrest on the streets (59,726).
A large number — 18.5 percent — of all arrests were for driving under the influence.

How much does crime cost taxpayers?
With all the city police departments, county sheriffs, prosecutors, judges, and local jails, it’s hard to put a single number on crime costs statewide, though it’s common for most counties to spend 70 percent or more of the county budget on criminal justice.
One easy way to look at what taxpayers are paying for crime is what it costs to run the state’s prison system.
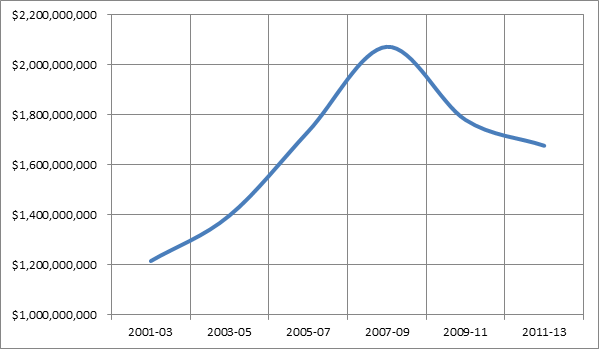
Here’s a look at what the state spent on the Department of Corrections from the 2001-03 budget (the state budgets on a two-year cycle, which they call bienniums) up to 2011-13.
The trend looked alarming from 2001, when we spent about $1.2 billion on state prisons, to 2007-09 when spending topped $2 billion. But since then, the trend is headed south, with spending in the current budget at about $1.7 billion.

